

May 25, 2026
Review management: 5 key performance indicators that may be missing from your current tool
Most review management tools slip up big time: they treat data as if it exists…
Powered by Jim


Table of contents
In today’s ultra-competitive market, acquiring a customer costs up to five times more than retaining them. This is where customer satisfaction plays a huge role as a happy customer becomes a loyal one; they will return, spend more, recommend you, and remain committed to your company. In this article, Partoo explains the ins and outs of customer satisfaction and why you should master the metrics.
Customer satisfaction measures how well your offer (product or service) matches customer expectations. It focuses on the gap between their needs and what you offer. If you exceed their expectations, customers will return; if not, they’ll use the competition.
In other words, if they’re happy, you’ll retain them, while if they’re not, you can kiss them goodbye.
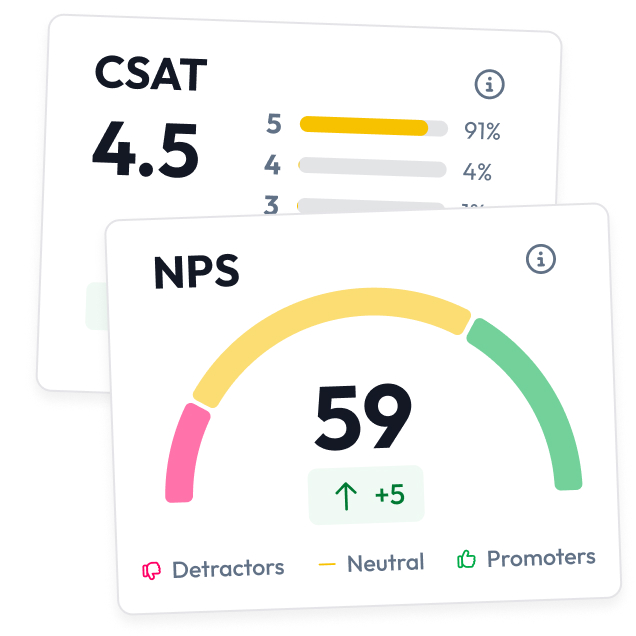
There are several key performance indicators (KPIs) that track customer satisfaction rates, with NPS and CSAT among the most popular.
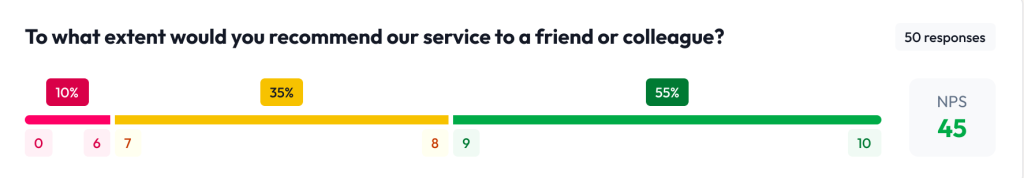
The NPS measures how likely customers are to recommend a brand, product, or service. It goes beyond a simple transaction; it measures a customer’s emotional engagement and their overall relationship with a brand. This KPI tracks how customer loyalty changes over time.
You’ve probably already answered a question along the lines of “On a scale of 0 to 10, how likely are you to recommend this company, product, or service to a friend or colleague?” It was an NPS-type question.
Respondents are classified into three categories depending on their reply, as shown in the table below:
| Score | Category | Description |
|---|---|---|
| 0 – 6 | Detractor | Dissatisfied customers who may harm your reputation |
| 7 – 8 | Neutral | Satisfied but not engaged customers |
| 9 – 10 | Promoter | Enthusiastic and loyal customers |
Thanks to a simple calculation, NPS lets you evaluate customer satisfaction and loyalty at a given time and monitor how their relationship with the brand changes.
The calculation used is as follows:
NPS = % of promoters – % of detractors
NPS scores may differ by country and sector (due to different expectations and scoring methods).
The table below illustrates the differences between various sectors. Sectors where purchases are complex or occasional (such as banking and insurance) often have a lower NPS. On the other hand, NPS scores may be higher in high-touch and service-intensive sectors such as luxury and retail.
| Sector | NPS* (average score) | Trends | Factors affecting NPS |
|---|---|---|---|
| Automotive | 41 | Relatively stable, but varies by brand | – Service quality and reliability – Brand awareness |
| Retail | 37 – 55 | Slight decline in recent years | – In-store experience – Offer personalisation |
Banking and financial services | 34 – 44 | Increase in some markets (especially in France). Significant gaps between institutions. | – The customer experience – Advisor quality – Digital services |
Insurance | 23 – 41 | Sector with a fairly low NPS | – Product complexity – Management of claims – Customer trust |
Luxury | 39 – 48 | Relatively stable (varies by country) | – Brand prestige – High level of service |
Median NPS (for all industries) | 42 | Generally stable with sector-specific variations | – Competitive pressure – Rising expectations |
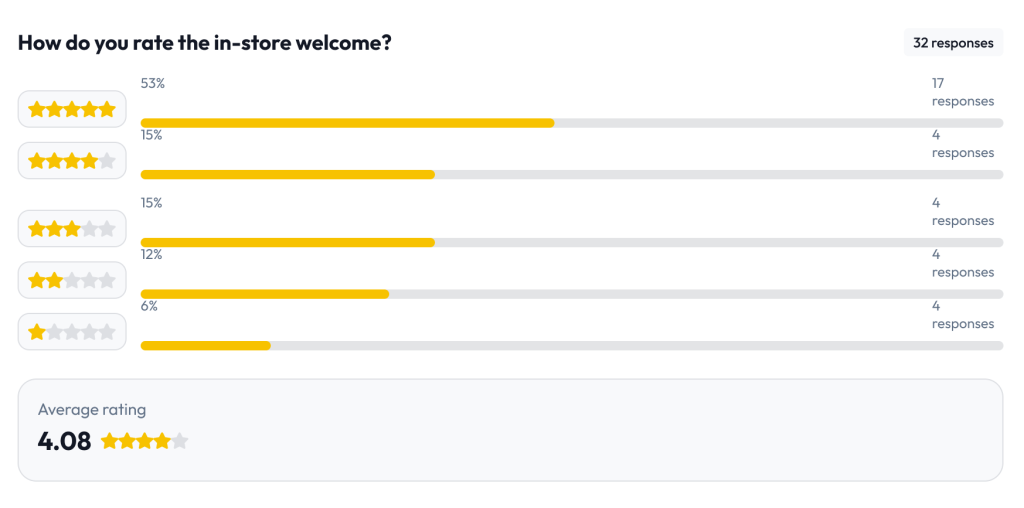
The Customer Satisfaction Score measures how happy a customer is immediately after an interaction, such as the in-store welcome or a purchase. It’s more direct than NPS; it targets a specific moment by asking questions such as “How do you rate the in-store welcome on a scale of 1 to 5 (or 1 to 10) where 1=very dissatisfied and 5 = very satisfied?”
The CSAT calculation used is as follows:
CSAT = (number of positive responses / total number of responses) * 100
The CSAT lets you quickly identify pain points in the customer journey and evaluate the performance of specific interactions.
These two KPIs work in tandem, letting you track your establishments at an overall and specific level.
| NPS | CSAT | |
|---|---|---|
| Purpose | Measures loyalty and recommendation | Measures immediate satisfaction |
| Scale | 0 – 10 | 1 – 5 or 1 – 10 |
| Perspective | Long-term | Short-term |
| Uses | – Evaluate overall brand perception – Monitor customer loyalty over the long term – Compare your performance to your competitors | – Evaluate post-purchase or post-interaction satisfaction – Quickly identify pain points – Test the impact of improvements to specific services |
Other valuable customer satisfaction KPIs
Although less common, these KPIs are also a useful way to track customer satisfaction:
Although less common, these KPIs are also a useful way to track customer satisfaction:
Measuring customer satisfaction is a strategic tool to turn customer feedback into actionable ways to improve performance. Tracking it means you can:
Satisfied customers are faithful customers. On average, loyal customers return more often and spend 67% more than first timers. By meeting customer expectations, you create an emotional attachment to the brand, turning a one-off purchase into a lasting relationship.
A delighted customer will mention your brand three times more than a “neutral” customer. High customer satisfaction draws new customers in thanks to word of mouth and organic recommendations (such as customer reviews), while also reducing the cost of attracting new customers.
It highlights issues that need urgent attention, such as long waiting times or poor service. This makes it easier to implement quick and targeted improvements to prevent potential complaints.
Survey feedback can reveal unexpected insights, such as requests for new services or personalised offerings. These insights can therefore open up new opportunities for operational improvements.
Customer satisfaction is more than a score or rating; it shows how well a business meets customer expectations, anticipates their needs, and forges lasting relationships.
Turn customer satisfaction into a lever to boost your performance!
An all-in-one tool that allows you to:
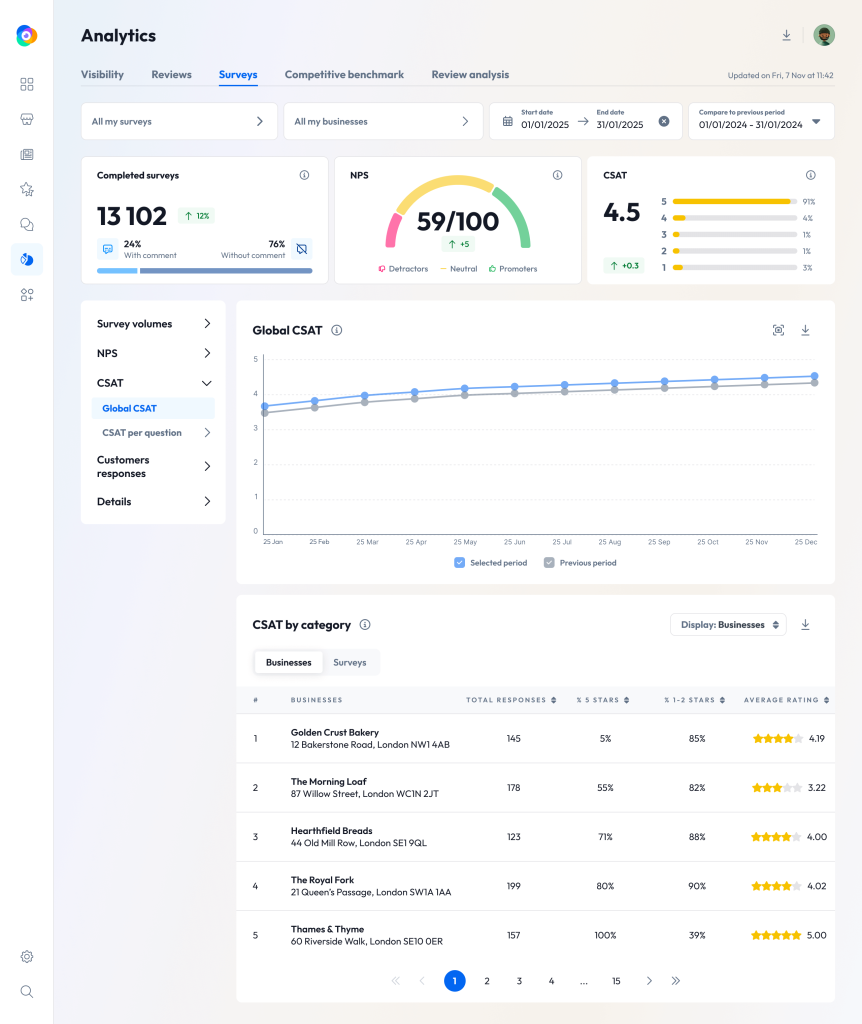
Partoo’s Feedback Management lets you collect, centralise, and analyse all your customer satisfaction data. Thanks to its clear, intuitive dashboard, companies can easily manage their various key performance indicators (KPIs).
https://www.questionpro.com/blog/nps-in-the-automotive-industry/, https://www.sobot.io/article/2025-benchmark-net-promoter-score-trends/, https://customergauge.com/benchmarks/blog/financial-services-nps-benchmarks, https://npsbench.com/nps-index-report/industry/luxury-goods, https://survicate.com/nps-benchmarks/.
Download the 2026 Barometer on online presence and e-reputation of businesses and gain practical insights to increase your chances of being cited by AI.
Want to easily develop your business through the Internet? It’s possible thanks to Partoo!
Most review management tools slip up big time: they treat data as if it exists…

4.2/5 stars… Most companies would be delighted with this rating. For us, however, you could…

The Voice of Customer (VoC) has long been used to measure certain KPIs: a quarterly…
Receive our best articles and practical guides directly in your inbox every month