



 Help Center
 How to get help

October 22, 2026
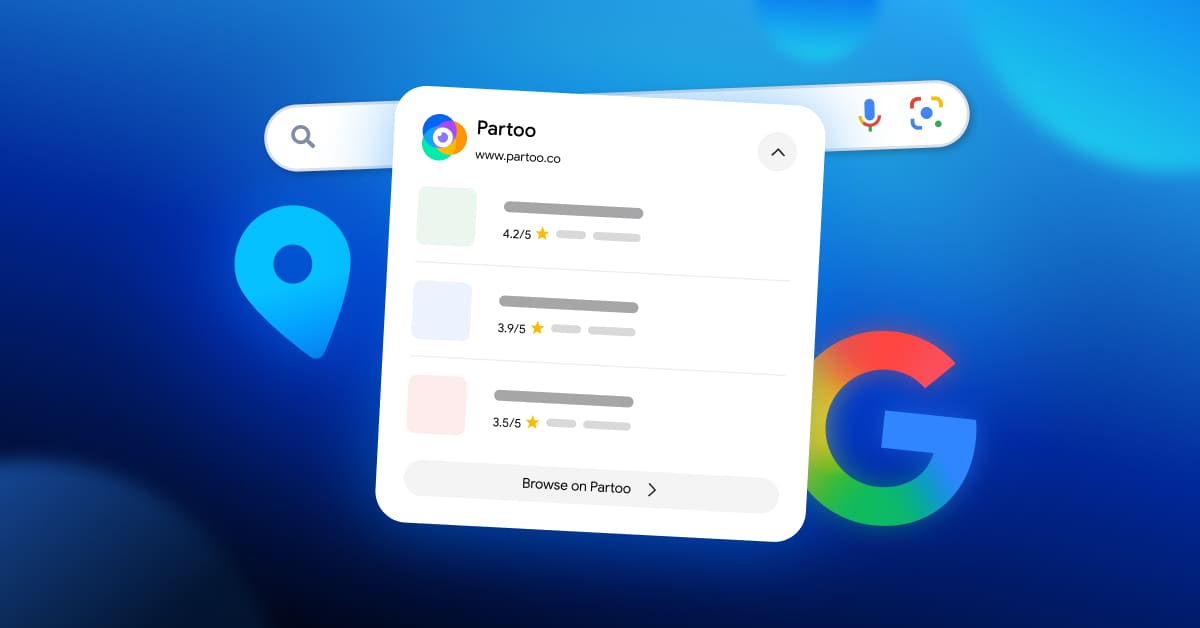
Partoo’s Local Pack now appears in Google search results
Since 18 September 2026, Google has been displaying Partoo’s Local Pack for many local searches…


Powered by Jim
 Written by Beatriz Sierra Sanchez
Table of contents
Across all survey methods, the median response rate for a satisfaction survey is around 10% (Survicate, 2025). In other words, nine out of ten customers you ask simply don’t respond. Faced with that, the usual instinct is to switch survey tools or send more surveys.
But the problem isn’t volume, it’s method. Success comes down to three things: what you ask, how and when you ask it, and what you do with the answers once they come in. We’ve rounded up all the best practices you need to get it right!
A survey that’s too long or poorly worded can lose respondents before they even get started. The rule of thumb: keep it to no more than 10 questions, and often far fewer for transactional surveys such as post-purchase or post-support surveys.
Go beyond that and drop-off rates rise sharply, especially on mobile (Clootrack, 2025).
Before writing a single question, be clear about what you want to learn. What decision or action should the survey help you take?
The right topics depend on your sector and the touchpoint in question. A local retailer, for example, may want to understand how welcoming the staff are, product availability or checkout waiting times, while a service business may focus more on the clarity of the advice provided, how easy it is to book an appointment or whether deadlines are met.
The customer journey is still the best place to start: identify the stages where satisfaction is most uncertain or friction occurs most often, and focus your questions on those areas rather than trying to cover everything.
The type of question also matters. Closed questions (rating scales, multiple choice) can be answered in a single click and generate data that is immediately usable, so they should generally be your default choice. Open-ended questions require more effort from respondents and more semantic analysis on your side, but they can uncover valuable insights. Use them where they add real value, for example at the end of the journey or as a follow-up to a low score.
Make sure your questions are also worded neutrally: ambiguous or leading questions can skew responses and discourage people from answering.
| ❌ Avoid | ✅ Prefer |
|---|---|
| “Were you satisfied with our fast, efficient service?” (leading) | “How would you rate the speed of our service?” |
| “What did you think of your overall experience, from your first interaction through to delivery, including customer service?” (double-barrelled) | “On a scale of 0 to 10, how likely are you to recommend our brand to a friend or family member?” |
| “Would you agree that our team listened to your needs?” (leading) | “Did our team address your request?” |
The best way to stay within the 10-question limit without sacrificing depth is to show questions conditionally based on the previous response.
If a customer gives the highest score, there may be no need to ask anything else. The survey can end there. A low score or a “no”, on the other hand, can automatically trigger a more targeted follow-up question. In that case, multiple choice is usually better than a free-text field, as it helps minimise friction and reduce drop-off.
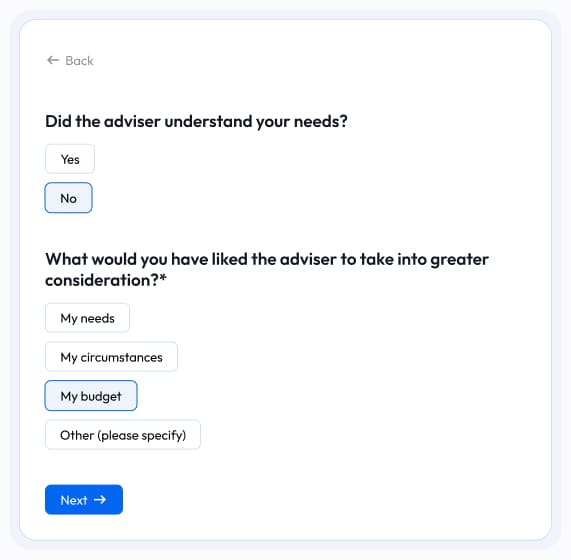
This approach has two benefits: it shortens the survey for the majority of satisfied respondents and turns negative feedback into structured, actionable data.
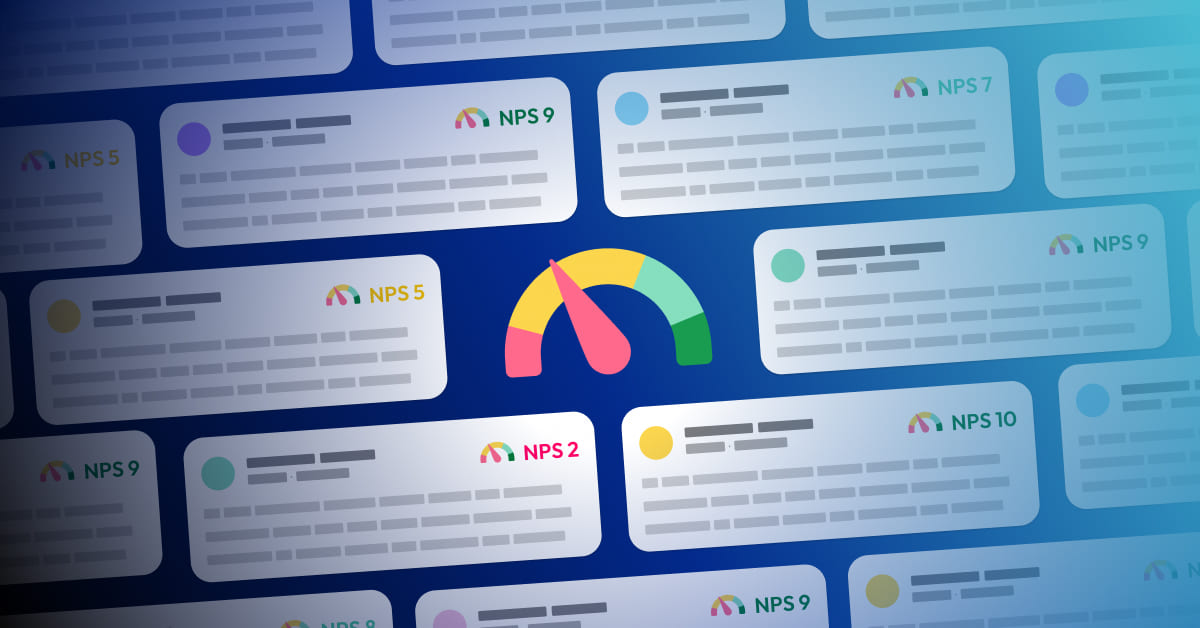
Three satisfaction metrics are commonly used in surveys:
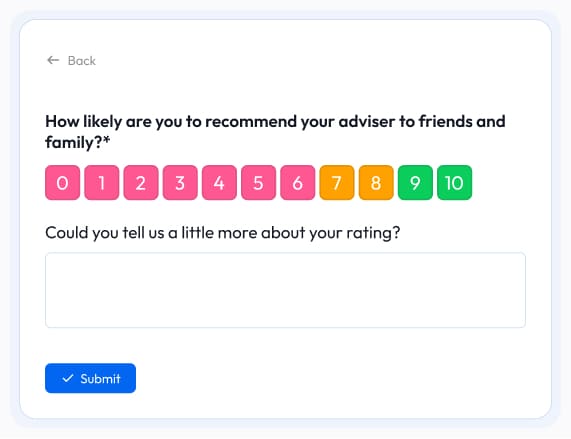
Using all three can make sense when each one answers a different question: NPS for the long-term relationship, CSAT for a specific touchpoint, and CES for the effort involved in a particular journey. Putting all three in the same survey, however, can make the questionnaire unnecessarily long.
Want to go further ?
To find out more about how to choose and track these metrics over time, take a look at our guide to the key customer satisfaction metrics to monitor.
To find out more about how to choose and track these metrics over time, take a look at our guide to the key customer satisfaction metrics to monitor.
The right time to send a survey depends on its purpose. A transactional survey should follow the event closely, within an hour or the same day after a support contact, or 24 to 48 hours after a purchase. A relational survey, by contrast, is sent at longer intervals and isn’t tied to a specific touchpoint.
Then there’s another equally important question: which channel should you use? Even a perfectly designed survey, sent at exactly the right time, is useless if nobody opens it.
Unlike an app or an in-store device, email doesn’t require customers to install anything or use any special equipment. As long as you have their email address, you can reach almost your entire customer base.
The trade-off is that your message lands in a crowded environment, competing with promotions, notifications and other emails for attention.
That’s why the message itself matters so much. The subject line, structure and ease of response can make a real difference to participation, far more than simply choosing the “right channel”.
Beyond the channel you choose, the format of the message also affects how much friction recipients experience. Displaying a rating scale directly in the body of the email (embedded NPS), so recipients can see the question without having to click through first, can significantly reduce drop-off when it comes to responding.
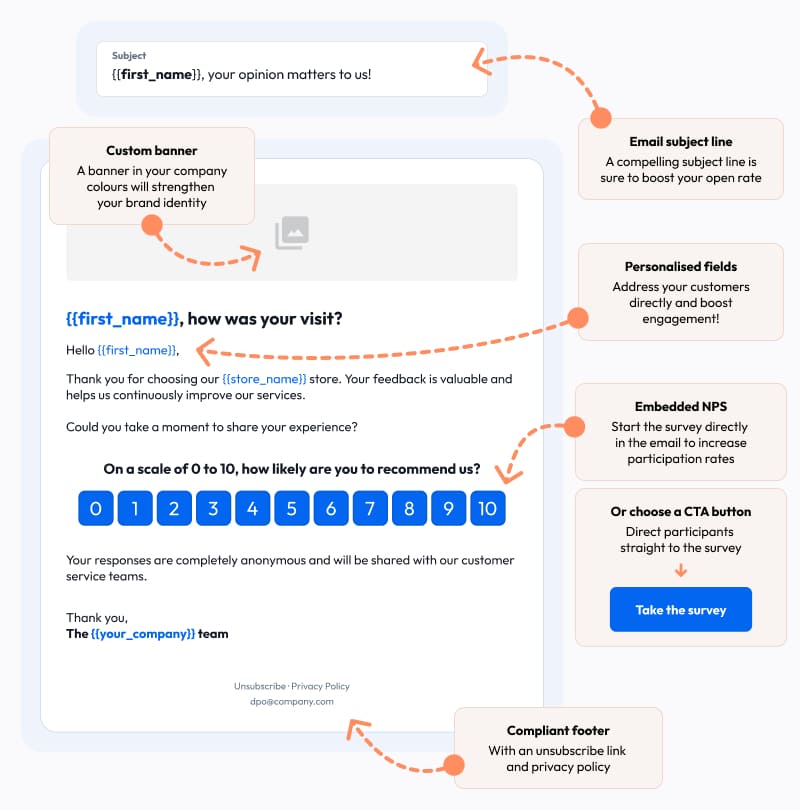
In practice, a good satisfaction survey email should include:
You now know how to build a survey that gets strong response rates: keep it short and well written, choose the right channel for the context, and design the email to minimise obstacles. That’s a solid foundation. But collecting responses is only the first step in a Voice of the Customer approach, not the end goal!
Once the responses are in, four more steps turn that feedback into a genuine continuous improvement loop: centralise it in a single view instead of leaving it scattered across tools and businesses; respond to every customer so they know their feedback matters; analyse the trends across all responses; and act on those insights by turning them into concrete decisions. Then the cycle begins again with a new round of feedback collection.
Worth noting
Once a customer has completed the survey, you can ask them to leave a public review if their experience was positive. Our article on requesting a Google review after a satisfaction survey explains how to do this without bombarding customers with too many requests.
Once a customer has completed the survey, you can ask them to leave a public review if their experience was positive. Our article on requesting a Google review after a satisfaction survey explains how to do this without bombarding customers with too many requests.
Even a survey with an excellent response rate is a missed opportunity if you never act on the results.
Localization Project Manager
Transform the customer experience across your businesses with AI
Download the 2026 Barometer on online presence and e-reputation of businesses and gain practical insights to increase your chances of being cited by AI.
Since 18 September 2026, Google has been displaying Partoo’s Local Pack for many local searches…
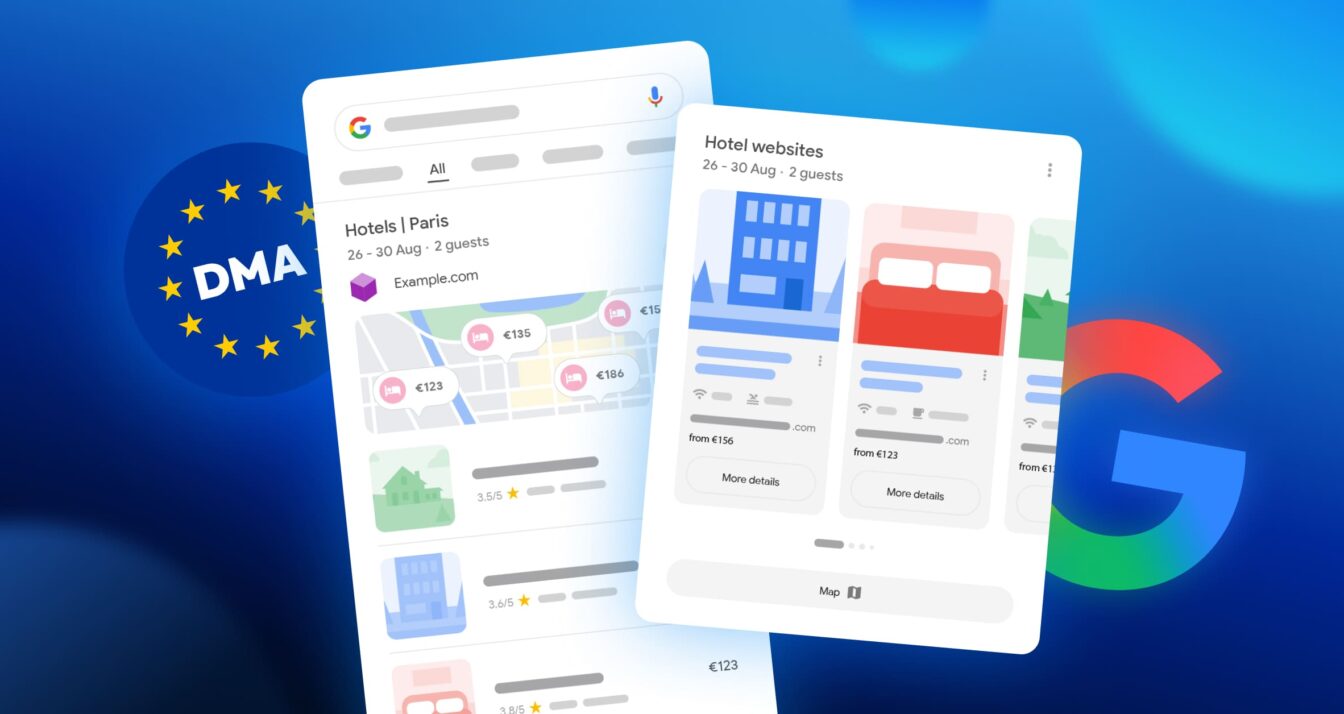
Google updated the appearance of its search results page in Europe on 8 September 2026…

Choosing the right voice of customer platform can transform how you manage CX, provided you…
Receive our best articles and practical guides directly in your inbox every month